Furniture and home improvement advertising report
Be on the lookout for data and insight on the following furniture advertisers:
Contents:
-
- 1 – Market trends
SECTION 1 – MARKET TRENDS
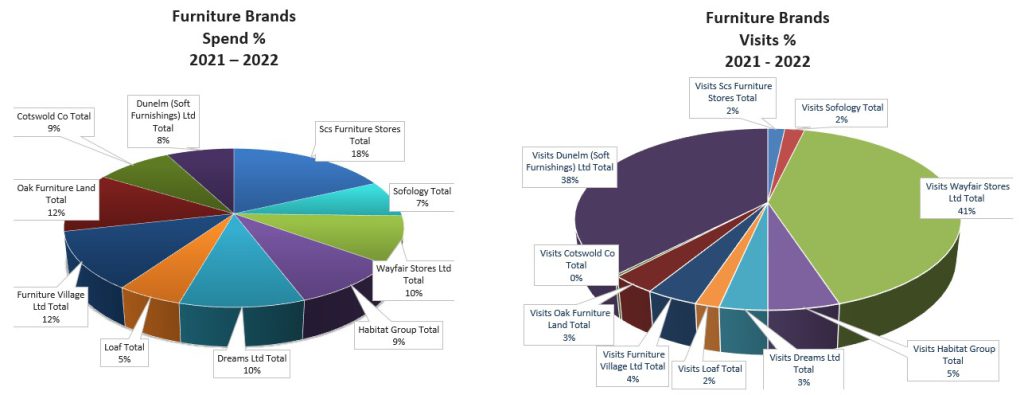
Spending has increased by 11% between 2022 and 2021 for all the Furniture Sector, yet visits have decreased by 45%. This almost 50% reduction in visits could be due to a shift in purchase behaviour post-covid.
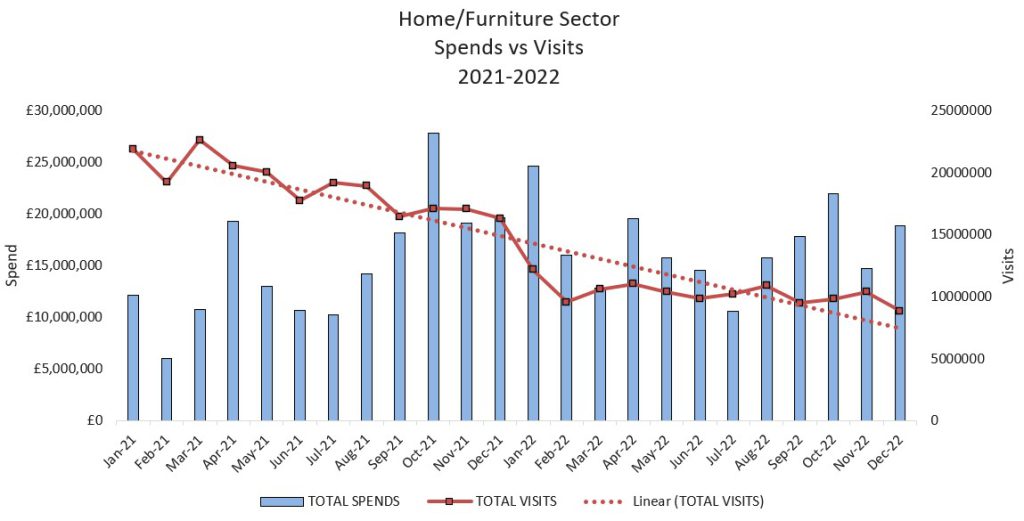
As a result of the shift to online point of purchase, furniture stores should improve the mobile app services they provide. By highlighting the ease of use, customised experience, and greater accessibility to technologies like virtual reality and in-store conferencing, retailers may increase consumer adoption.
2022 compared to 2021
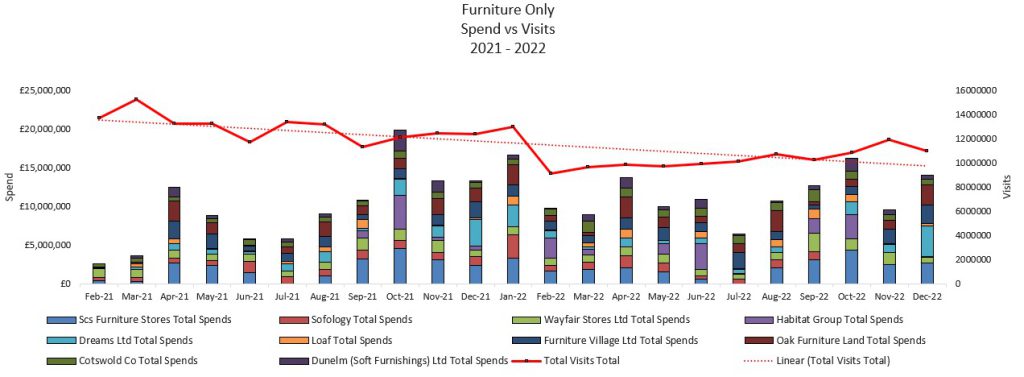
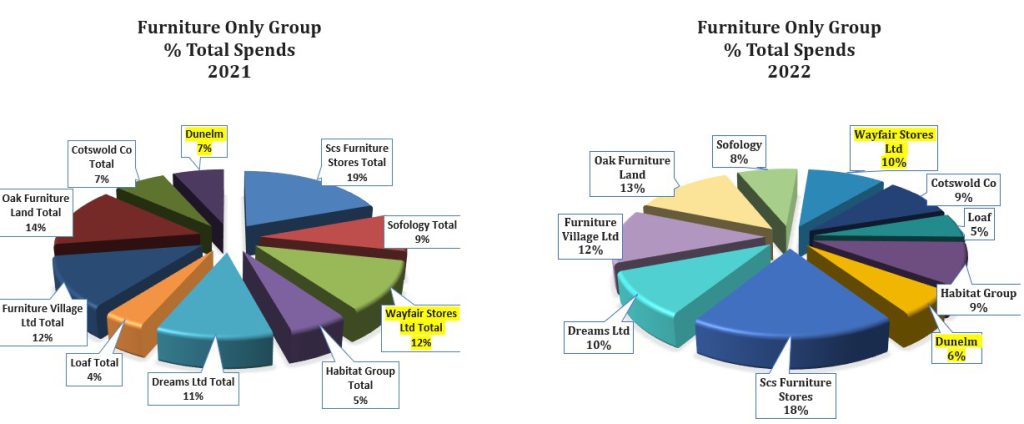
In 2022, investments in the ‘Furniture Only’ cluster increased by 24%, but visitors decreased 20%. Although this is less than the entire Home Furniture sector, it appears to follow a similar pattern. April and October are the most active months in terms of investment for both years, and spend does appear to impact visitor growth.
SECTION 2
Wayfair (41%), and Dunelm (38%), have the best visitor engagement levels, accounting for only 18% of Total Spends.
SCS Furniture, accounting for 18% of the budget amongst the other 9 brand listed below, only reached 2% of total visitors across the group.
Oak Furniture Land, with a budget accounting for 12% of spend across the brands, reached 3% of total visitors amongst the defined set of brands.
Total spend 2021 – 2022
Looking at spends between the two years, we can see how the two key drivers in visits (Dunelm and Wayfair) cut their ad investment by 3%. Dreams increased its total percentage spend by 5%, however this did not appear to increase visits.
SECTION 3
In 2022, the carpet industry slashed ad investment by 62%, although visitor numbers only fell by 8%.
With a 70% drop in TV investment for 2022 and only an 8% drop in visitors, advertising seemed to have little impact in delivering new visitors.
Combined advertisers: carpet sector
| 2021 | 2022 | % Differential | |
| Spend | £7,988,370 | £3,029,926 | -62.07% |
| Visits | 4373405 | 4014564 | -8.21% |
Tapi vs Carpetright: who is the biggest spender?
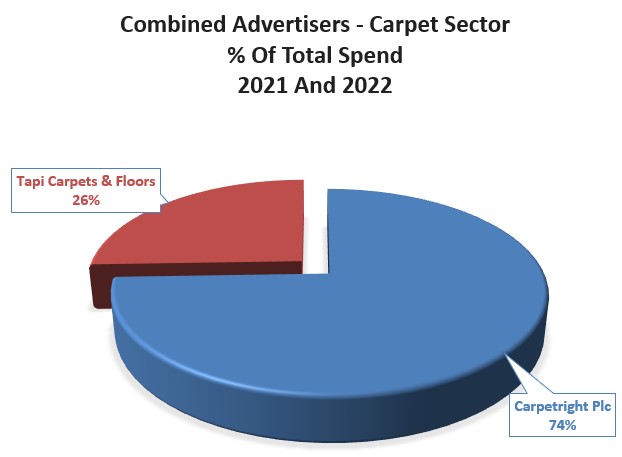
- Carpetright is the sector’s largest investor, accounting for 74% of total spend, with a 57% reduction in 2022 across all media, except for Direct Mail.
- Tapi represented 26% of overall investment in 2021 but slashed budgets by 70% in 2022.
| Advertiser | Media Type | 2021 | 2022 | Spends differential % |
| Carpetright | Digital | £60,322 | £32,715 | -45.77% |
| Door Drops | £1,084 | £0 | -100.00% | |
| Direct Mail | £0 | £43,067 | 100.00% | |
| Outdoor | £20,732 | £1,032 | -95.02% | |
| Press | £330,188 | £330,503 | 0.10% | |
| Radio | £676,785 | £516,409 | -23.70% | |
| TV | £4,281,654 | £1,332,800 | -68.87% | |
| Total | £5,370,765 | £2,256,526 | -57.99% |
| Advertiser | Media Type | 2021 | 2022 | Spends differential % |
| Tapi Carpets & Floors | Digital | £2,660 | £120 | -95.49% |
| Press | £14,477 | £159 | -98.90% | |
| Radio | £0 | £2,437 | 100.00% | |
| TV | £2,600,468 | £770,684 | -70.36% | |
| Total | £2,617,605 | £773,400 | -70.45% |
SECTION 4
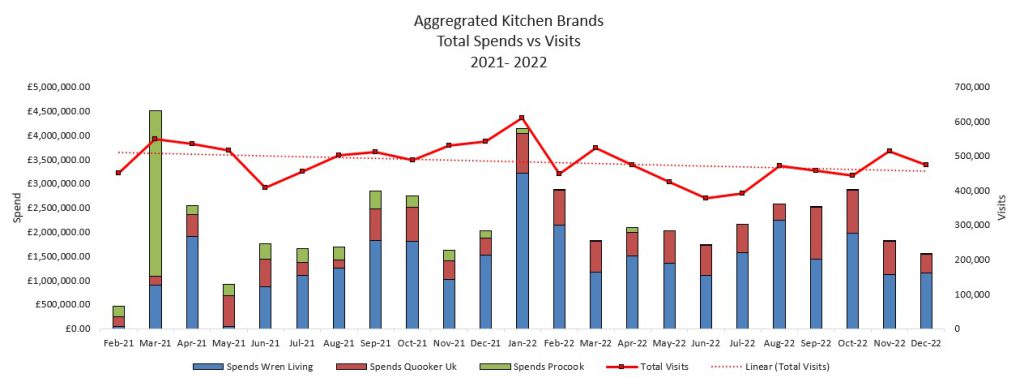
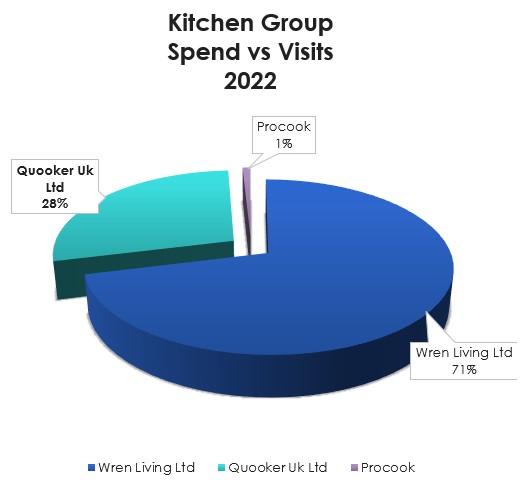
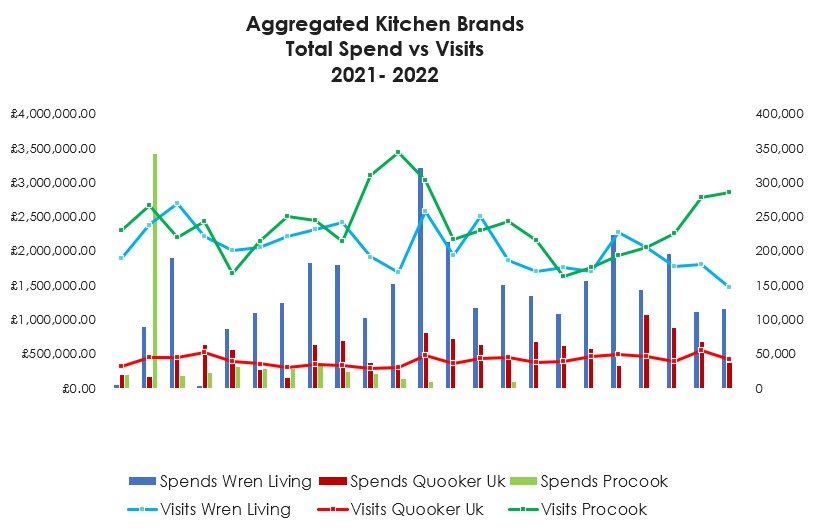
The kitchen industry boosted spend by 16% overall, although visits decreased by 6%.
Procook, which was the largest generator of visits amongst it’s counterparts in 2021, dropped investment by 96% in 2022, taking budgets to zero.
Brand awareness is strong for Procook
Quooker is struggling to generate visits despite spending £7 million more than Procook and being significantly more present throughout the two years.
SECTION 5
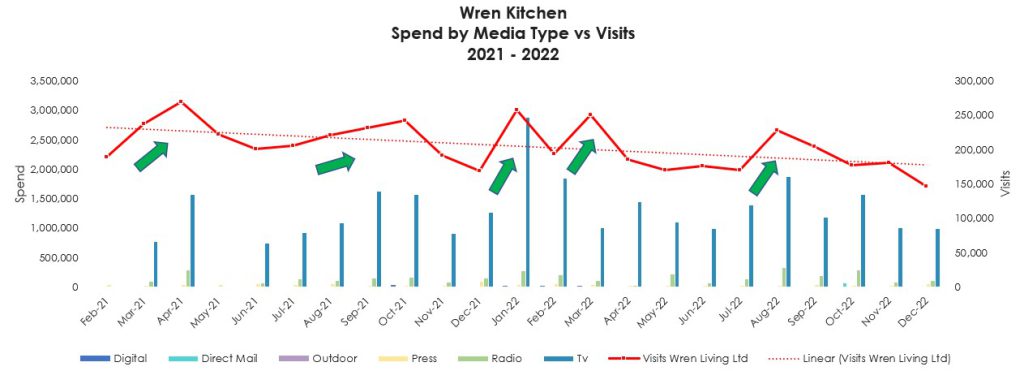
Wren Living visits are driven by TV activity
In the chart below we can see how an increase in TV spend is followed by an increase in web visits.
Visits will be impacted by seasonal trends
The primary factor influencing visits is demand for each brand’s core products. Although Wickes makes significant ad investments in the autumn and winter, the most active time of year for visits is spring.
With investments made throughout the year, Wickes experiences its busiest periods in terms of visits during the spring months and it doesn’t seems to generate new visitors during other times of the year. A factor would be the products that Wickes sells – highly specialised in outdoor, garden, and renovation projects that are typically carried out in the spring.
For Vaillant, the months leading up to winter coincide with a peak in visitors. Media investment also increases during this time. Since Vaillant is the market leader in boilers, heat pumps, and heating systems, it makes sense for them to launch a media campaign during the month when there is a peak in demand for its products.
SECTION 6 – MEDIA TRENDS
Overall, TV is the dominant medium – 78% share of all spend. Radio and digital are the second and third most popular media channels among all brands.
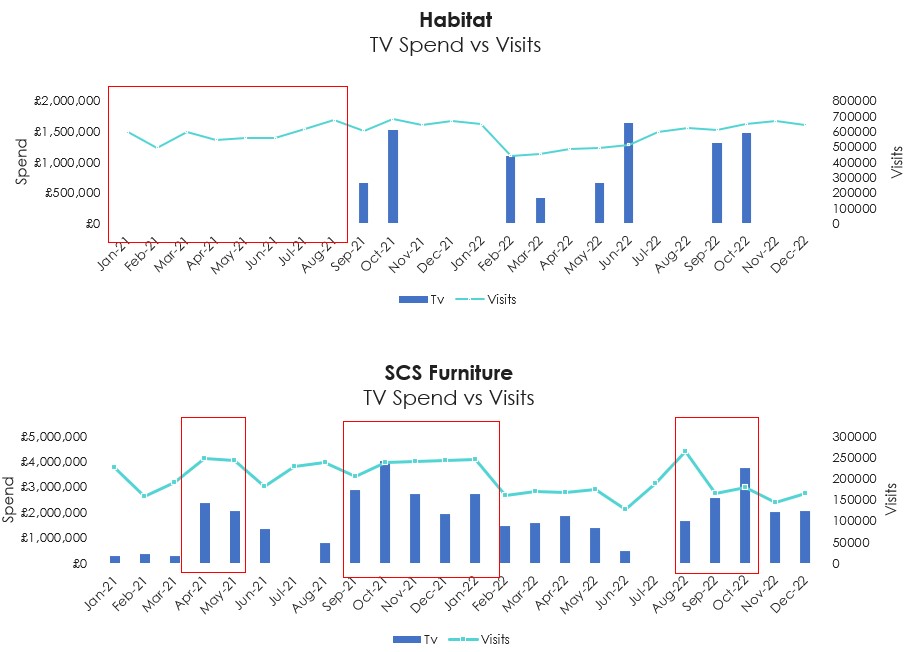
We know that visits for SCS Furniture are not very high when compared to similar brands that invest less, such as Habitat. In the below charts, we evaluate the correlation between the amount of money spent on TV advertising and the number of visits.
Habitat’s TV campaign does not seem to have an impact on visitation. We can see that even in cases where there is no TV investment, the visits follow the average line for the entire period.
On the other hand, SCS Furniture’s TV Campaign appeared to have had an impact on visits. For periods of larger investment, we can see how visits increase as well. Similarly, with periods of lower investment, visits decreased.
Habitat – what’s the secret?
Habitat’s ability to maintain high visitation over longer periods of no investment is due in part to its higher-than-average Brand Awareness score (Brandindex).
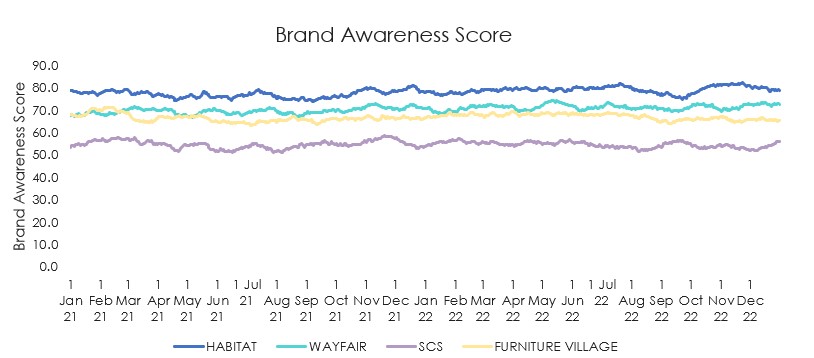
SCS Furniture’s Awareness Score (Brandindex) was the lowest of the cohort. It can be seen as crucial for them to invest in TV ads, helping them remain competitive and ‘steal’ visits from competitors.
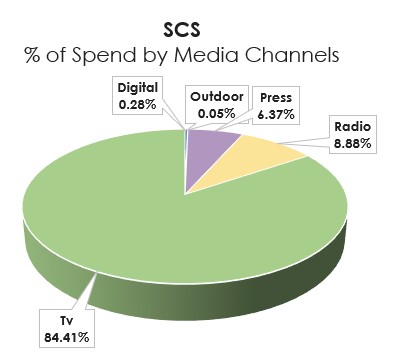
A robust omni-channel strategy is one of the most efficient ways to raise awareness for their products. SCS seemingly rely on one media channel. The split on the right shows that there is a major weekness in SCS’ multi-channel strategy.
SECTION 7
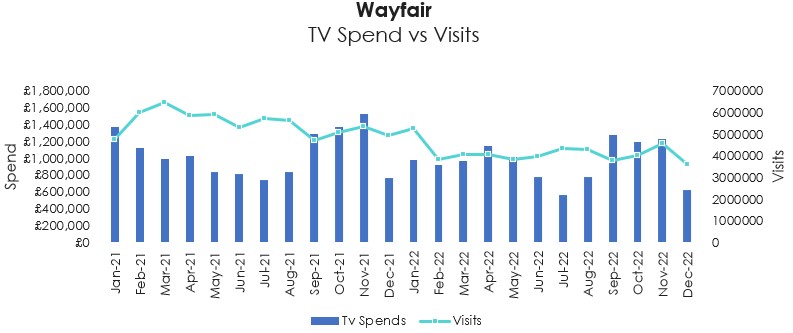
Wayfair is the brand that generates the most visits across all TV investors
Large investment on TV has enabled Wayfair to generate the strongest Ad Awareness score of the Category (Brandindex).
Wayfair’s strategy of being ‘always on’ has resulted in an exceptional Ad Awareness score. That, combined with offering a wide range of affordable furnishings, as well as dedicated days throughout the year with discounts of up to 50%, is the key to how they generated 10X more visits than some of it’s competitors.
SECTION 8
The second-largest media channel overall in terms of spend is radio
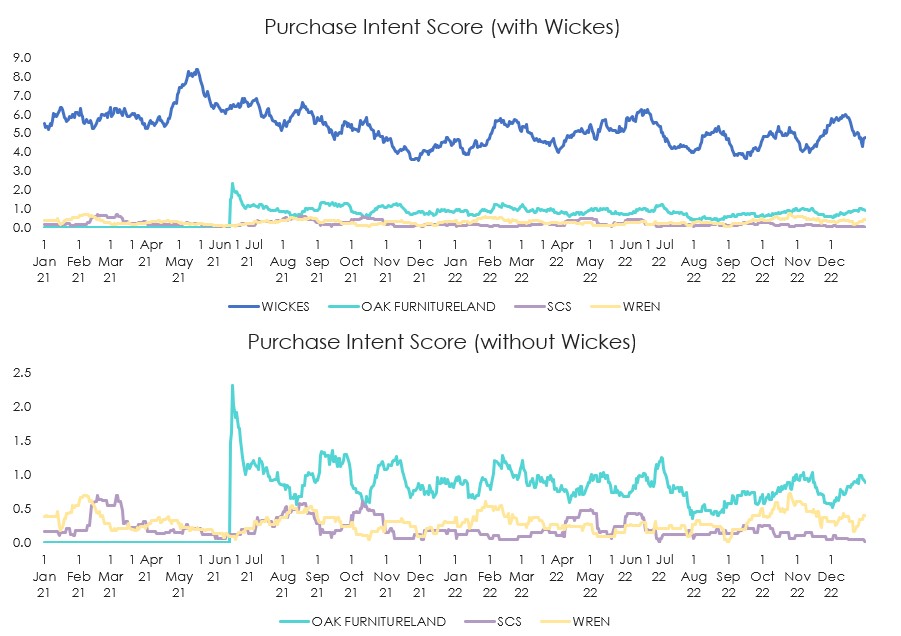
The persuasive power of radio advertising naturally increases trust, purchasing intent, and personal cues. The highest awareness score is displayed by Wickes and Oak Furnitureland, followed by Wren and SCS Furniture under 60%.
What about Press?
According to Nielsen, Press represents 3% of all ad investment by brands in the Home/Furniture Sector.
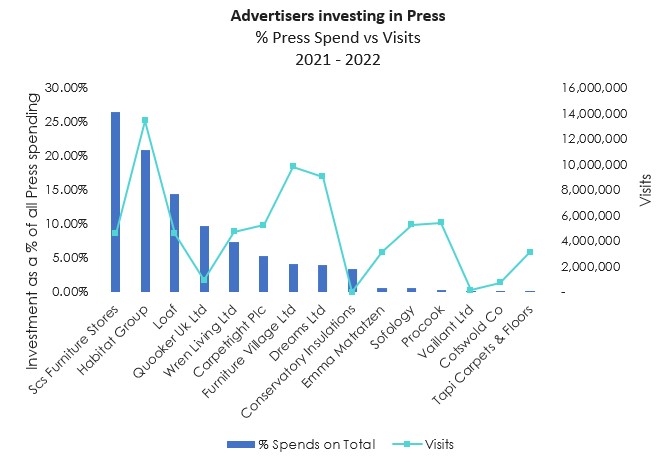
Brands invested over 50% more in 2022 than they did in 2021. With SCS and Habitat spending far more than their competitors – accounting for over half of total spend within the sector.
Investing in press can ‘boost’ TV campaigns and increase visitor traffic, however it appears that this strategy isn’t helping to lift visits for SCS Furniture.
According to Nielsen, SCS predominantly allocated budget to the News editorial area, which as seen in the above charts, did not appear to aid in attracting visits.
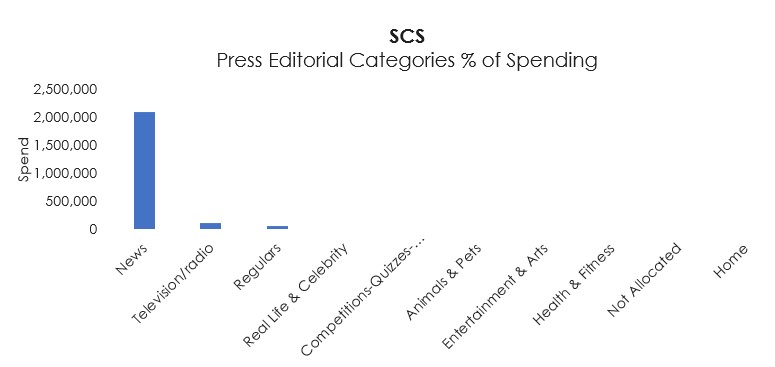
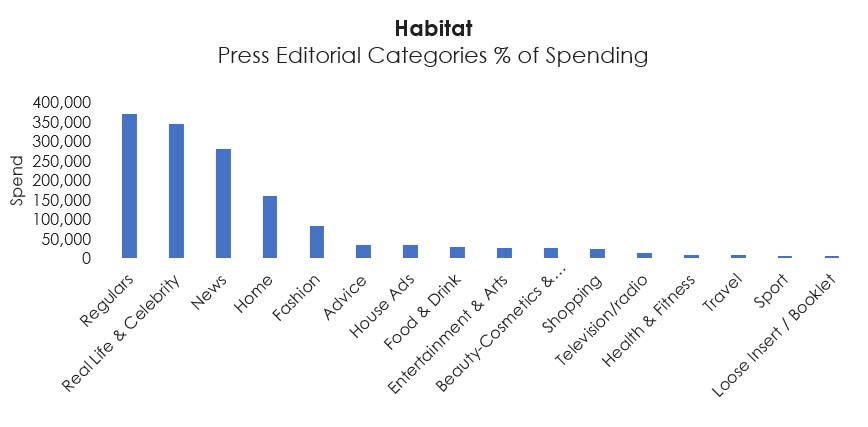
On the other hand, Habitat is expanding market reach by diversifying its investment which is evident with their site visit numbers.
How can furniture and home improvement retailers grow and optimise moving forward?

Malcolm Landers London Board Director LinkedIn
“After a buoyant period for the industry during the pandemic, as people rushed to improve their home environments – the furniture and home improvement industry has seen stalling growth and marketing spend.
This malaise has only deepened as we head through 2023 with the ‘cost of living crisis’ and rising interest rates adding further uncertainty to the market. For the furniture and home improvement market as a whole, spend for the Jan-June period was down 24% YoY for 2023 marking that shift in consumer confidence.
So with the benefit of hindsight, what can we learn from the past year?”
Back to the Future
Despite many speculating that COVID would herald a new era of shopping habits and the accelerated death of the physical store, 2022 data suggests that this couldn’t be further from the truth. Online visitation to the brands we analysed, saw major declines in 2022 despite media spends increasing YoY. This trend has continued in 2023 with footfall reported up 10% YoY in February 2023. Whilst online presence and user experience remains of central importance to growth, this illustrates that an omni-channel approach remains key with physical availability still an important tenant for the industry.
Changing Picture
We’ve also seen some major changes regarding the brands that are driving spends within the sector – whilst the likes of Wayfair, Habitat and SCS were dominant players across 2022 this picture has changed in 2023. Wayfair in particular have dropped back only spending £750k in Jan-Jun 2023, compared to £6m for the same period 2022, with Habitat also reducing budgets by around 80%. The traditional players such as DFS, Furniture Village and Oak Furniture Land continue to invest heavily. This trend could be partly driven by disparity in different age groups as to the impacts of the current economic challenges, older age cohorts more likely to shop with traditional legacy brands are less likely to need to reduce spending – therefore those retailers see lesser drops in demand.
Awareness helps maintain SOM
Our research also illustrates the importance of using broadcast channels to drive brand awareness, revealing how heightened levels of awareness can maintain businesses through difficult economic periods. Brands such as Habitat have been able to maintain high visit levels, despite reductions in spend and due to their previous higher investment in ATL channels, see a slower decay in awareness. With media costs currently seeing deflation, particularly in the TV market – now is a great time to invest for brands whom have the available budget, being able to drive higher than usual SOV and lower than average pricing.
Support channels
Whilst TV is unsurprisingly the key channel for this sector, with its broad reach, un-paralleled effectiveness and audio-visual qualities – it is surprising to see lower usage of other broadcast channel opportunities such as outdoor, radio and print. Via our unique WorkRestPlay.Live insight tool, we can gain insights into how important these channels are in reaching consumers in different mindsets. In particular, we can see how they reach audiences at critical periods, such as weekends, where TV can sometimes struggle. Utilisation on these channels in the right way, could be a great way for a retailer to gain a competitive advantage.
Get in touch today
Get a second opinion on your advertising investment. Find out how Europe’s largest performance marketing agency can combine data science with TV, digital and offline advertising expertise to drive business performance.
"*" indicates required fields


Our team is happy to answer your media questions
Fill out the form and we’ll be in touch as soon as possible.
"*" indicates required fields