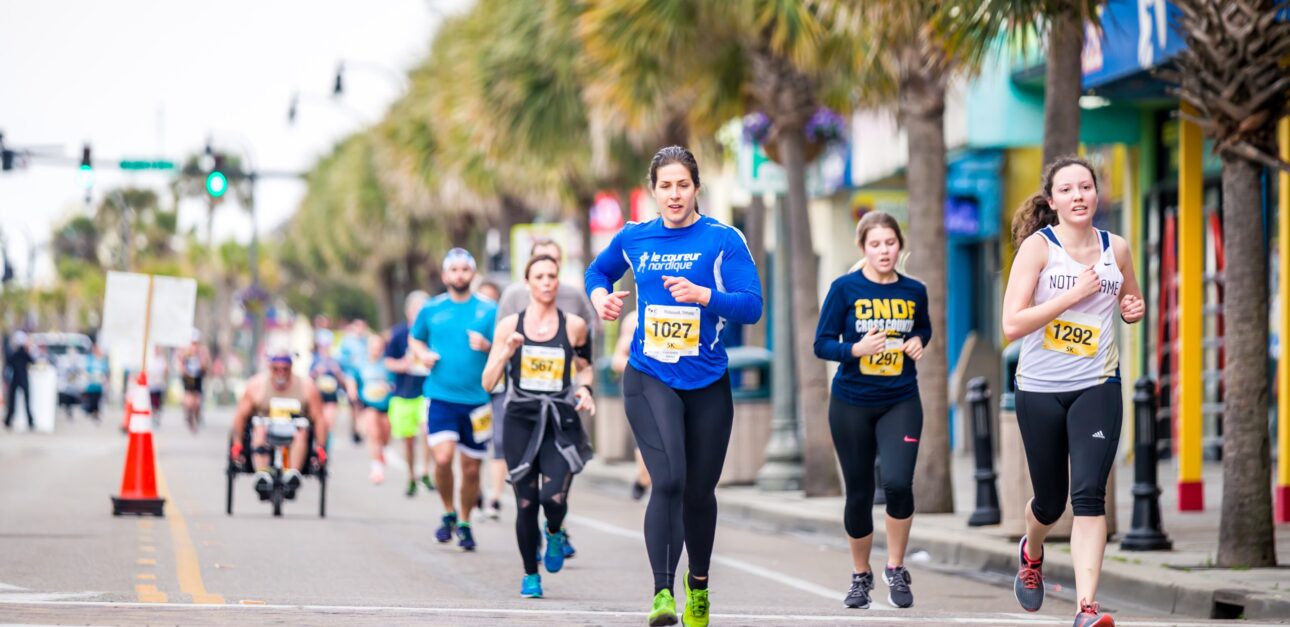
The State of Charity Advertising
This analysis is based on charities spending £1M to over £10M on advertising. Be on the lookout for data and insight on the following advertisers:

Contents:
What is the general outlook for charities?
NCVO state that charities are being squeezed by the cost-of-living crisis, as donations fall and more people are seeking support. But is it really all ‘doom and gloom’ for the sector? Let’s take a look.
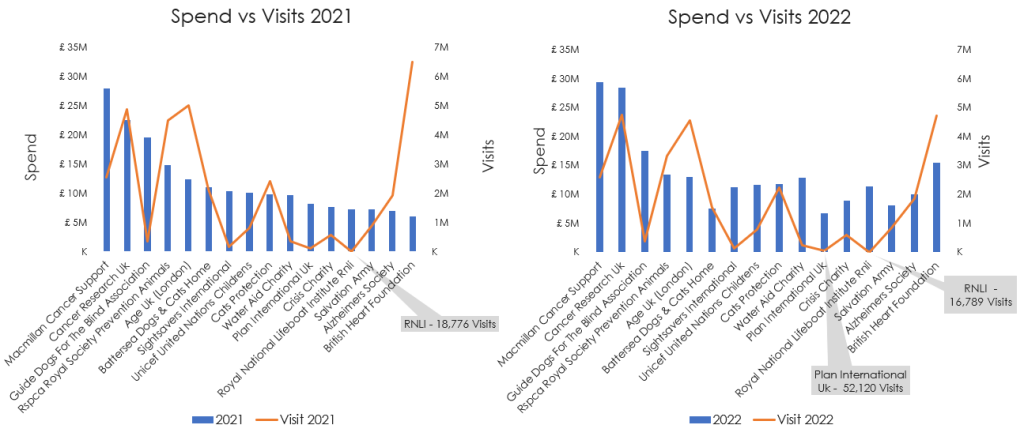
The below chart shows overall spend vs visits for the charity sector:
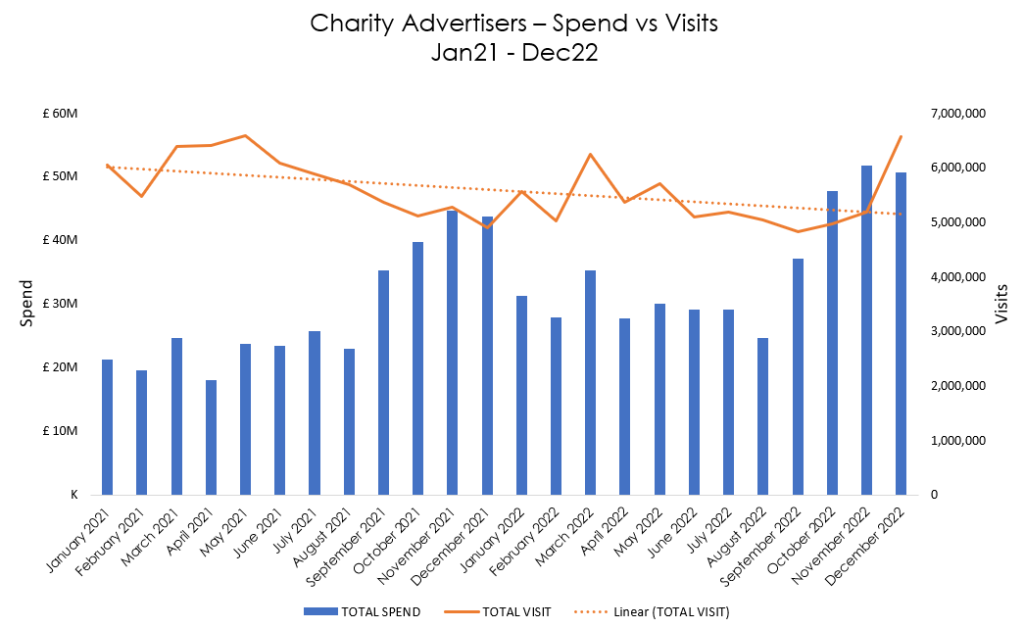
Following a significant peak in terms of visits between March 21 and May 21, there is a decline throughout the summer months when investment is also low. The number of visitors increases during the winter period of 2022, but then drops as we approach summer 2022 again.
The spike in visits in March 22 is likely driven by DEC’s emergency appeal for Ukraine on the 3rd of March and another urgent appeal following the floods in Pakistan.
Investment in the sector regularly peaks in Q4, as this is seasonally a key period when it comes to donations and gifting. The heightened investment can see an increase of visits tail throughout December pre and post-Christmas and even into January, to deliver an overall cost-efficient period.
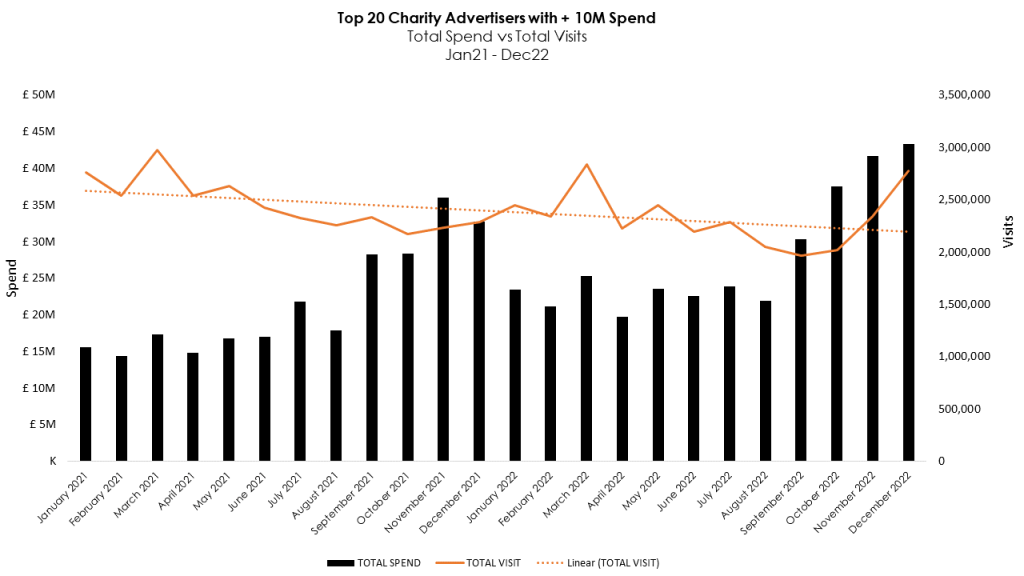
Who are the top 20 charity advertisers spending +£10M?
Despite some hangover from Covid lockdowns in early ’21 potentially affecting spend, we see a similar pattern for visits YoY. The Q4 period continues to be the peak for investment, and whilst visits overtake annual trends in Nov, Sep & Oct, volumes are down YoY. See total spend vs visits for the ‘big spenders’ below:
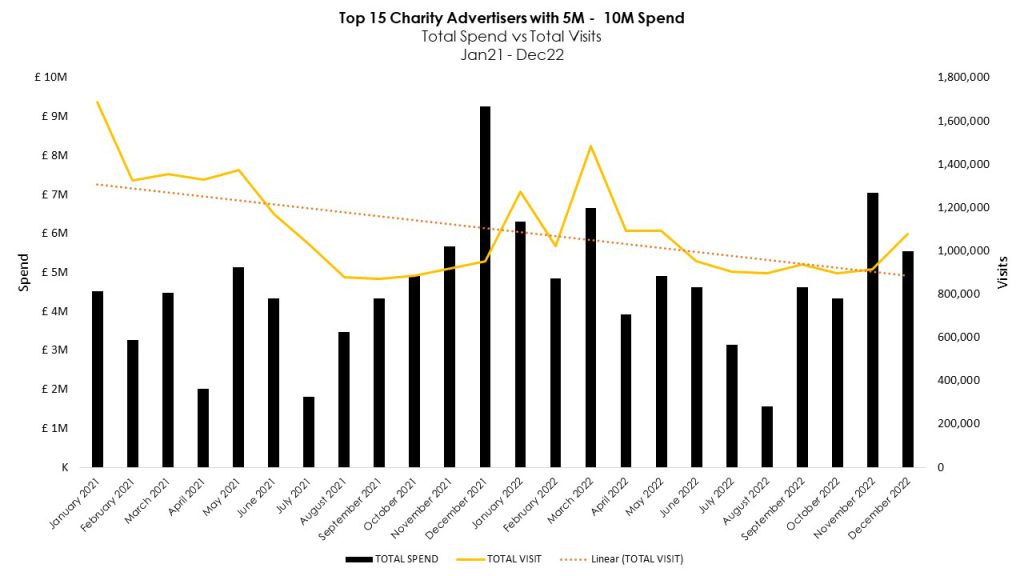
Top 15 charity advertisers with £5M – £10M spend
Brands in the 5M to 10M category do not appear to follow the same pattern as the sector’s major investors. Investment fell by 15% in Q4 22 compared to Q4 21, with the month of December 22 falling by 40%, having a negative impact on visits during the autumn and winter seasons. See below:
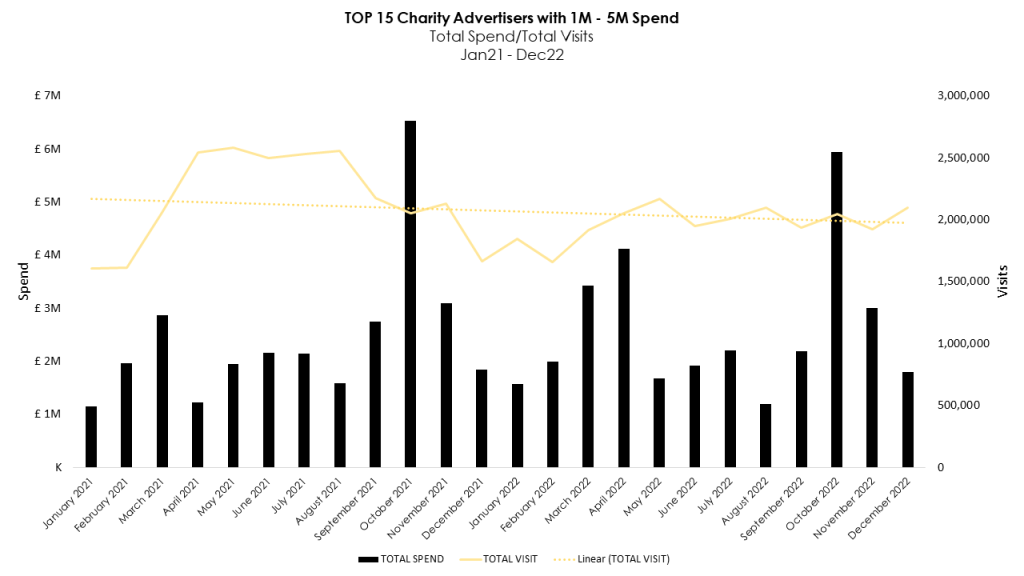
Top 15 charity advertisers with 1M – 5M spend
Visits and spend for brands in the 1M to 5M category is fairly flat in comparison. Peak investment for all 15 advertisers in this spend bracket is in October, mostly driven by Movember.
This strategy (investing heavily in just one month) was adopted by all these brands, but does not seem to drive significant visits, as shown below:
Top charities by spend & visits (Jan 21 – Dec 22)
Some major charity advertisers increased their investment in 22 by 13% compared to 21, but there was a decrease (-14%) in visits YoY.
The YoY drop in December was driven by DEC who spent over £1m in Dec 21 and cut all spend in Dec 22; highlighting just how impactful DEC’s campaigns can be. Prostate Cancer UK, World Cancer Research Fund and Leprosy Mission also cut spend in Dec 22.
Has the profile of the typical charity giver changed?
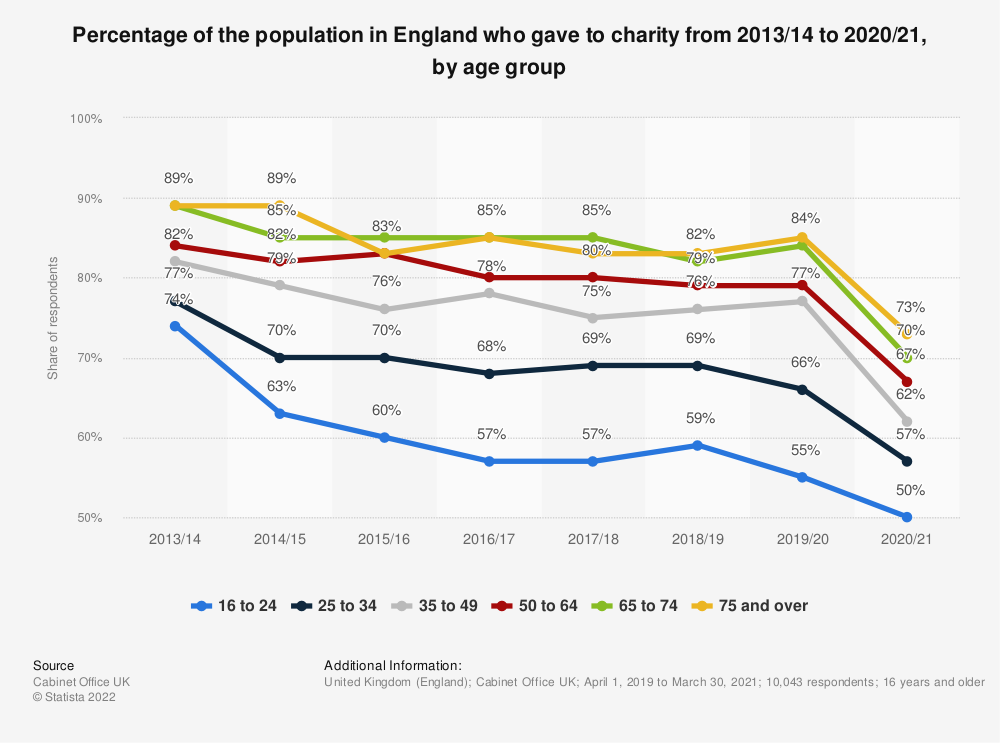
The simple answer is no, the ‘typical’ charity giver has remained fairly consistent. Older age groups (in particular the over 75s) and females are still most likely to donate. Ages 75+ are 60% more likely to donate in comparison to other age groups (according to TGI). As shown below, charity donations dropped amongst all age groups from 2020 – 2021.
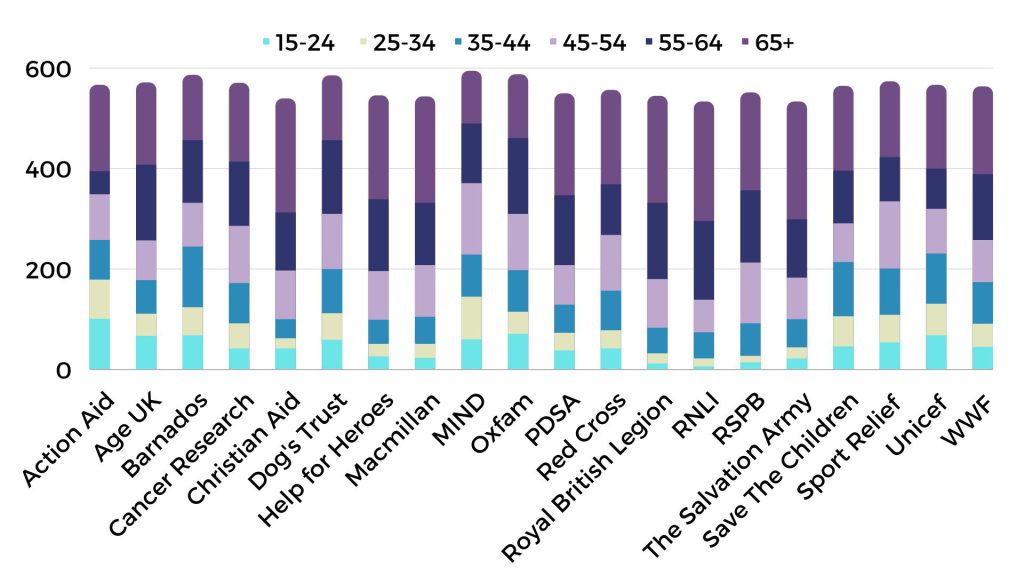
Those aged 65+ index higher than other age groups for the following charities:
Podcasts – are charity donors listening?
Charity donors are tuning in to podcasts, and TGI data reveals that Alzheimer’s Society donors are 68% more likely than other donors (within this advertiser group) to listen to a podcast 2-5 times a week. Guide Dogs donors are also avid listeners, being 46% more likely to listen to a podcast 1-2 times a week.
What does TGI data reveal about podcast topics and charity donors?
Alzheimers donors are 67% more likely to listen to sports podcasts, and those that have donated to The Salvation Army are 73% more likely than non-donors to listen to Food and Drink podcasts, and 66% more likely to listen to News and Politics podcasts.
Those aged 65+ that have donated to the Salvation Army are 38% more likely to listen to News & Politics podcasts. Food and Drink is popular across charities.
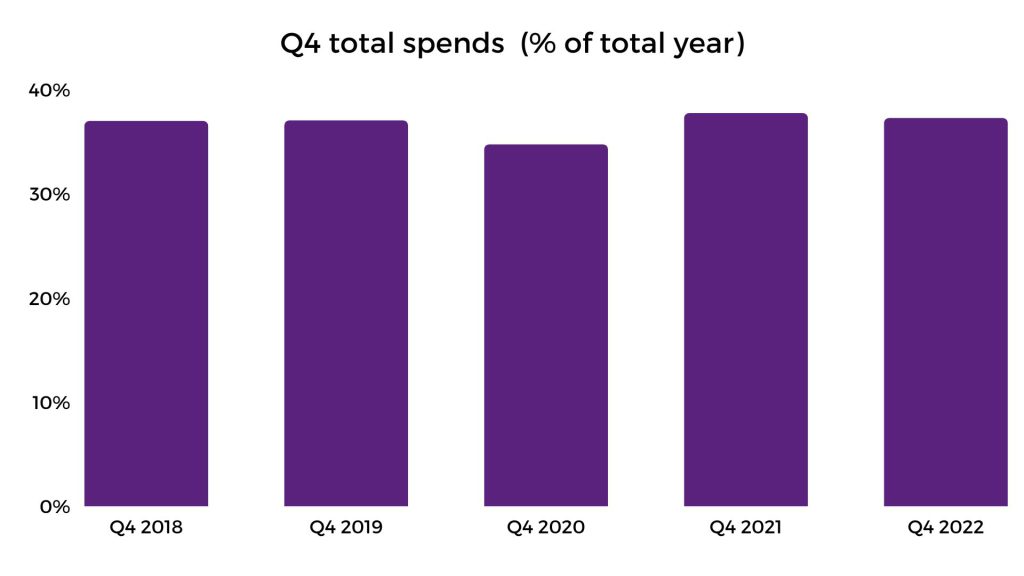
October – December remains a cornerstone for charities
This period has always been key for charities, and this is unlikely to change. In Q4 22, the total spend differential increases, but much less so than in Q4 21. This reflects the sector’s upward trend since 2018, but recent inflation and higher interest rates along with higher paper costs and general media inflation can make the Charity Marketplace more unpredictable and difficult. The % that Q4 accounts for in the year has remained relatively constant.| Q4 2018 | Q4 2019 | Q4 2020 | Q4 2021 | Q4 2022 | |
| Total Spends | £53,872,088 | £64,591,007 | £64,591,007 | £87,206,127 | £98,236,764 |
| YoY % Differential | 10.1% | 8.9% | 35.0% | 12.7% |
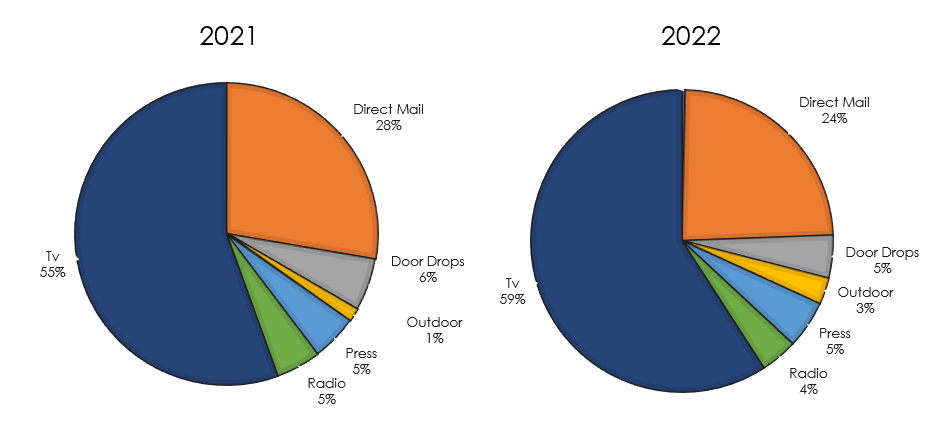
Which media is dominant amongst charity advertisers?
TV is the dominant medium and this is unlikely to change. It is still a great value medium, can be scaled (or reduced) accordingly, and has both immediate Performance and Brand (or Cause) awareness strengths
TV advertising – a power medium?
Even with some price inflation, TV still offered great value – historically and vs 2019. The amount of stations, flexibility that Covid allowed advertisers continued (booking late, amendments etc), public sentiment was generally positive (until Sep / Q4.) ensuring that TV was a Must Have for most charity advertisers. Low-cost entry points for both Media and Creative allows easy and quick tests. Working alongside a digital strategy can provide impressive results. There has been much talk regarding moving traditional Linear TV spend into Video on Demand (ITV X, All4, Sky VOD). As much as these offer targeting opportunities, the vastly increased cost per ‘000s (x 4-10 versus traditional linear CPTs) makes it a much more mathematical decision – in a performance world, wastage’ (i.e. reaching wider than just the main target audience) is still good.What about Print?
There was a very slight increase in spend for press YoY, driven by Cancer Research UK.
Print, 2021
| Type | Spend | % of Print | % of All Spend |
| Inserts | £2,598,929 | 12.69% | 0.62% |
| Press | £17,873,985 | 87.31% | 4.29% |
Print, 2022
| Type | Spend | % of Print | % of All Spend |
| Inserts | £2,672,669 | 11.66% | 0.60% |
| Press | £20,239,673 | 88.34% | 4.52% |
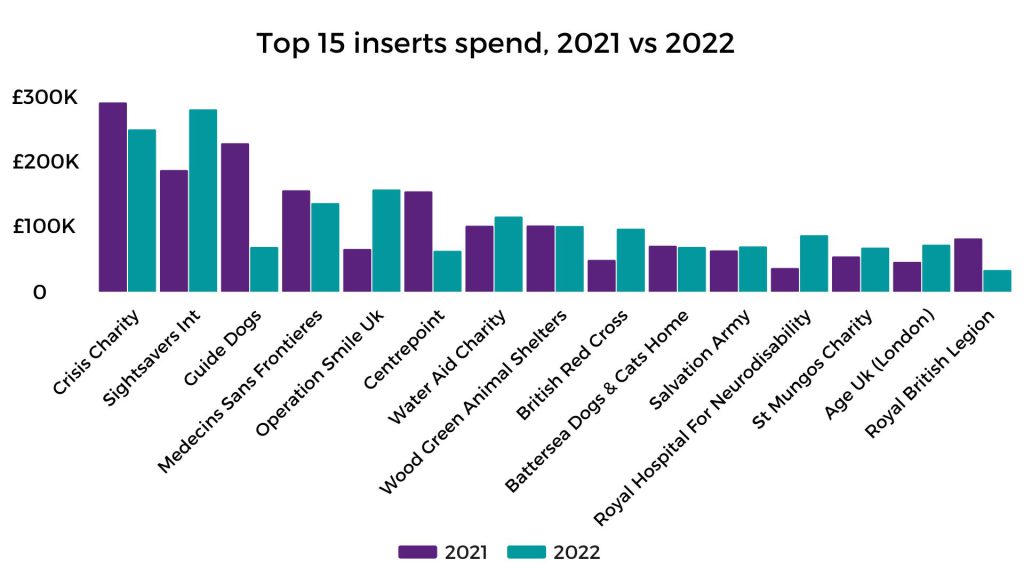
And who is spending on inserts?
Despite a slight decline YoY, the investment on inserts has remained fairly consistent over the years. However, the cost of living crisis hasn’t missed out paper/print and we can expect this media to be hit by increasing prices in 2023.
Paper has been getting increasingly more expensive over the years, but with energy prices spiking in 2022 and more so this year, we’re likely to notice additional costs to both producing paper, and printing on it.
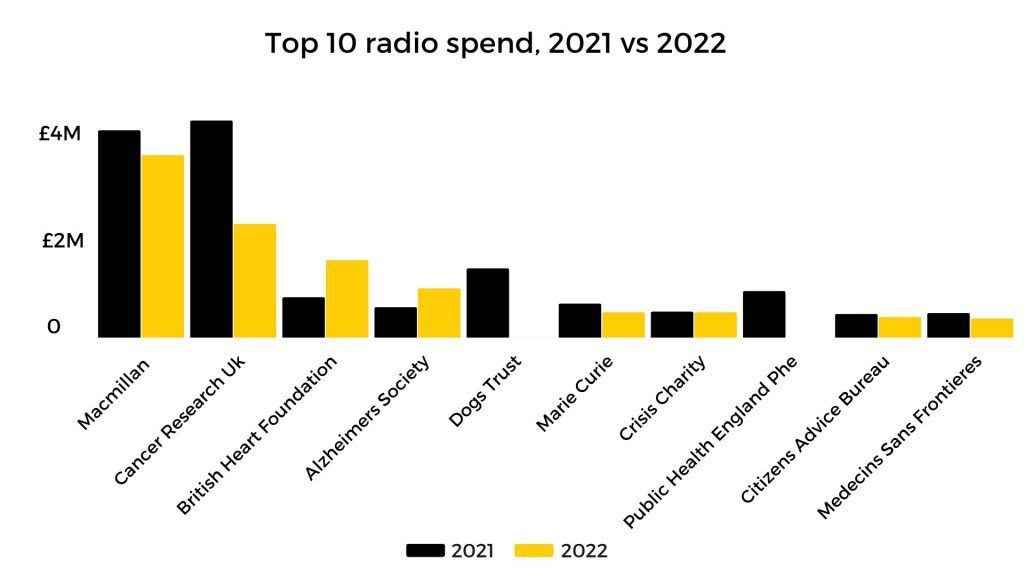
Radio vs Outdoor spend from 2021 – 2022
Only 3% of total media investments go toward outdoor advertising, but post-Covid in 2022, we can see a significant increase of +128%; suggesting increased usage as a brand or message medium rather than pure performance. Radio has moved from 5% in 2021 to 4% of spend in 2022, which seems mostly used by MacMillan and CRUK for event-based campaigns.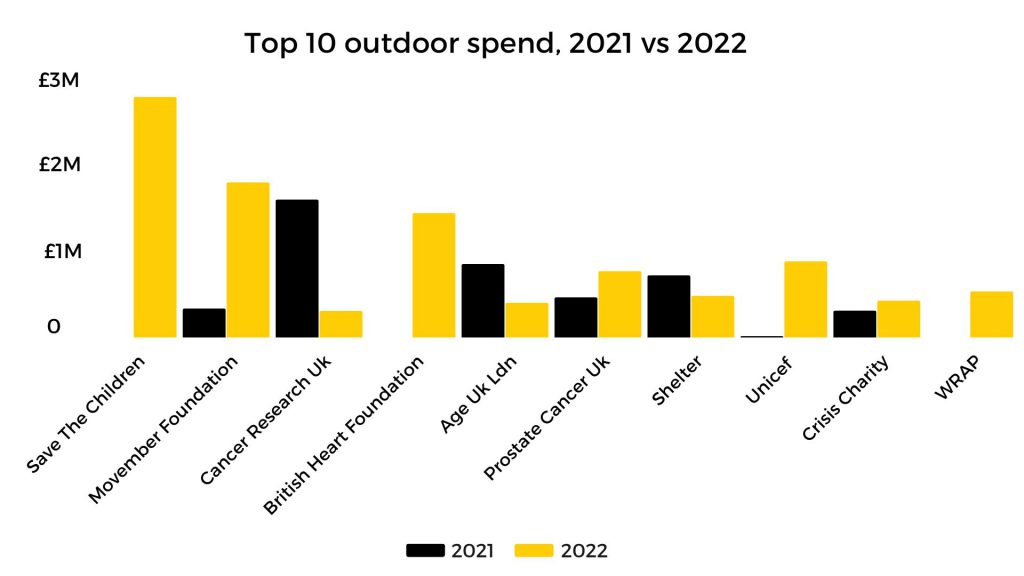
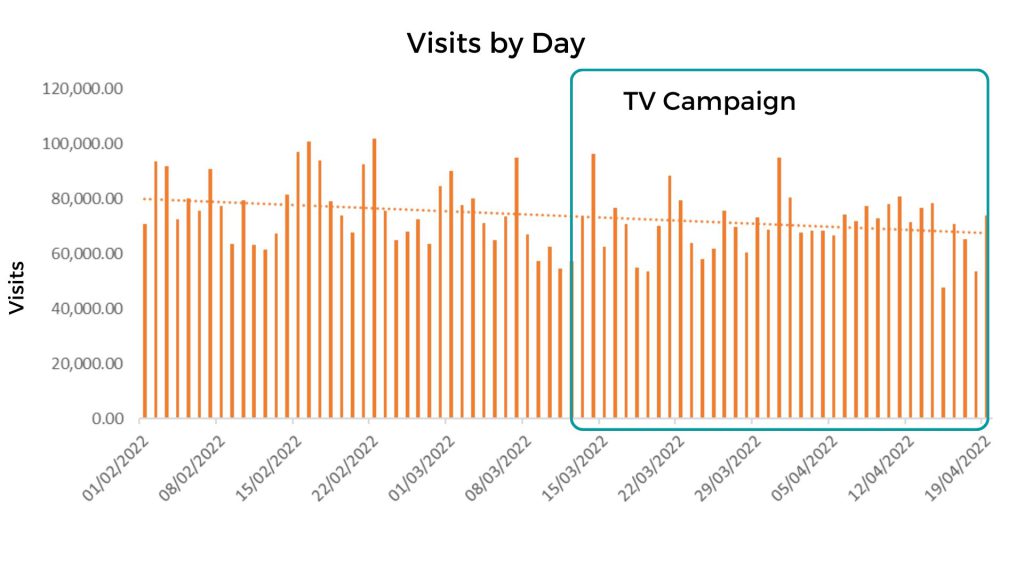
Event-based fundraising – did it deliver for Cancer Research ? – Race for Life
The charity spent over £2m promoting the event on TV, which represents 15% of annual TV spend.
-
- The TV Campaign ran from 14th March – 19 April 2022.
-
- Spend increased by 6% YOY (inflation rather than actual increase).
-
- Front weighted – with 83% of TVrs delivered from 14th March – 10th April 2022.
However, we found that visits dropped from average of 76k visits a day in February, to 70k during the TV campaign; a fall of 7%. However we do accept that registrations and donations may have increased, however this isn’t a true indication of performance as registrations (or other KPIs) may have increased, but a drop in visitors is worrying.
What about Macmillan? – Coffee Morning
The first Coffee Morning in 2022 was on the 30th September 2022. The charity spent over £3.5m promoting the event on TV, representing 22% of annual TV spend. The TV campaign ran from 4th July – 29th September 2022.
-
- Spend increased by 2% YoY.
-
- 1,089 Adult TVRS, DR led – only 25% TVRS in peak.
-
- Quite flat delivery, only tailing off in the last two weeks of the campaign.
Did it deliver?
As with Cancer research – visits fall during the campaign period, but only by an average of 1k a day (27 – 26k). Overall visits for the group were down by 2% – a visit level which is on the industry average.
Despite a decrease in visits, in 2021 they raised over £11M with Coffee Morning, and as with Race for Life – LTV and returning donors are huge factors in continuing with the event.
90-second ads continue to dominate
From 29% of est. costs in 2019, to 36% in 2022. This is at the expense of 60sec ads that have reduced from 35% to 31% Interestingly the Charity sector refuses to have a significant shift from longer commercials (60 sec+) to shorter (30 sec and less). Yes, the premium paid for 10s and 20s is not as cost effective as a 30 (or 60 / 90) but used strategically can increase frequency to harvest the activity that has appeared before / in other media. BHF, RSPCA, Sight Savers and Plan International are the only advertisers in this group not using 30” in 2021.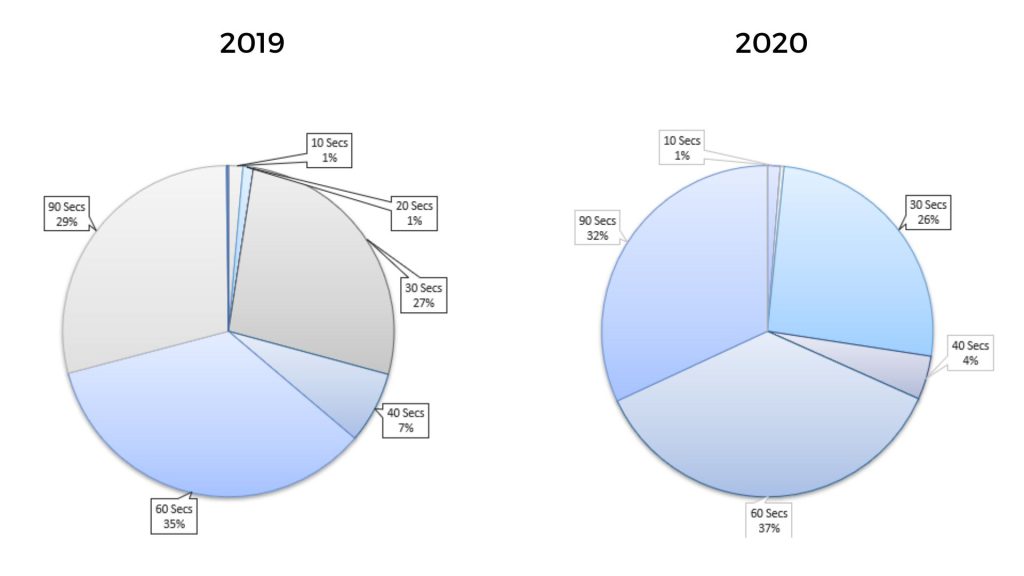
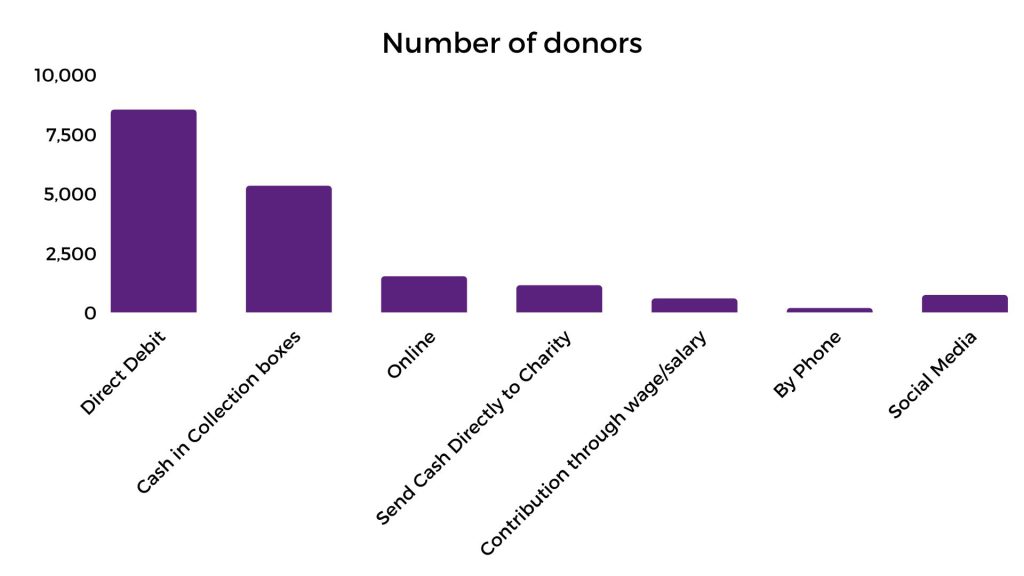
How are people donating?
The pandemic further pushed the sector and their target audience online, and online transactions rapidly grew. Online donations are now far outweighing donations by phone.
Some charities are however, slow to recognise this, still relying on long time lengths to drive calls, as opposed to increasing reach by using 30” or lower and letting their websites do the work.
Crisis proved you don’t need to overspend in peak to reach key charity audiences
There will always be an element of peak in DR advertisers, but anything above 20% should raise red flags for DRTV advertisers. It is not surprising to see advertisers who have overspent in peak falling down in terms of visitors, as they are not reaching the core audience cost-effectively. Plus, the consumer is more likely to be involved with the programme and potentially less likely to respond.
What do we think?
The outlook for charities is looking stable going into 2023 despite the ongoing cost of living concerns. Visits were on the up throughout 2022 (particularly in Q4), with a small decrease of -14% YoY.
Strategies differ across spend brackets with advertisers spending +10m increasing their spend consistently from Sep – Dec in 2022, and successfully driving a sharp increase in visits. Advertisers spending 1M to 5M present a different approach, with peak investment occurring in October for both years. However, this strategy seemed to just about maintain visits as opposed to increasing them.
TV remains a key channel for the sector, accounting for c.59% of spend in 2022 – a slight increase from 2021. 2022 was quite a turbulent year for TV pricing and impacts, so heading into 2023 with a steadier outlook, we would expect TV spends to continue to grow.
Outdoor took a step back in 2021, with Save the Children, BHF and WRAP cutting spend completely. This was however back up in 2022 (post-Covid) as we saw a significant increase of +128% YoY.
Little has changed in terms of who’s donating, with the over 75s and females consistently the most likely to donate. However, we can see that certain appeals can break that mould inc. DEC appeals, Mind and Sports Relief, which can reach a younger audience for both donations and participation. That said, we may see a decrease in donors across all age groups as more people are seeking support from charities and fewer are donating (if squeezed by increased cost of living).
More people are donating online, and some charities may not be reacting quickly enough to this migration. Slightly shorter spot lengths and an increased focus on digital could improve reach and cost-effectiveness.
Get in touch today
Get a second opinion on your advertising investment. Find out how Europe’s largest performance marketing agency can combine data science with TV, digital and offline advertising expertise to drive business performance.
"*" indicates required fields
Who do we work with?
See how one of the UK’s largest independent media agencies has consistently been building businesses and brands for over 25 years


Our team is happy to answer your media questions
Fill out the form and we’ll be in touch as soon as possible.
"*" indicates required fields